

AFTER THIS LESSON
You will be able to
- Distinguish a short spike from persistent basis
- Understand the role of mark and index prices
- Avoid treating a large gap as low risk
PRACTICE ON REAL SCREENS
IXOR and exchange examples
Interfaces and live market values may change. Use each screen to understand what to verify, not as a current trade setup.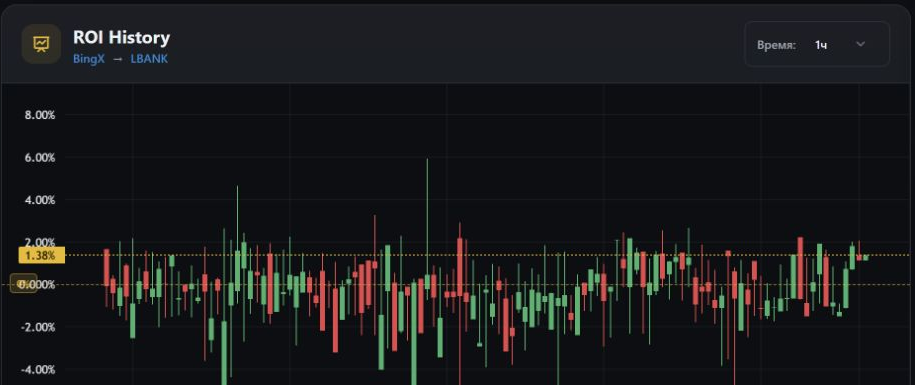
The chart shows historical behavior for one direction between two exchanges. It helps reveal ranges and outliers but does not promise another convergence.
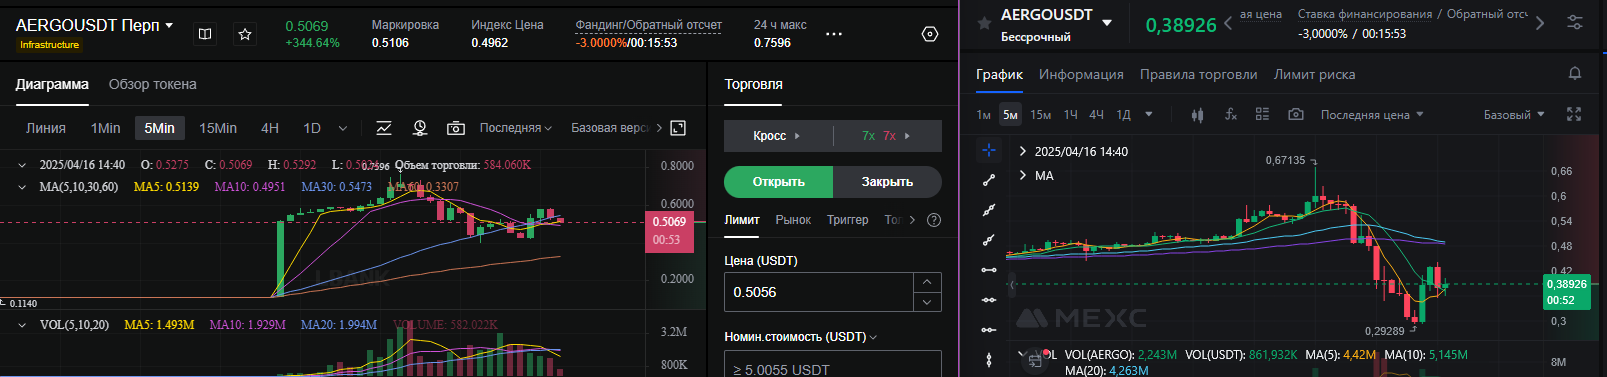
In this archived example, AERGOUSDT perpetual appears on LBank and MEXC with materially different last prices. The screen proves only that a dislocation existed: verify contract identity, bid/ask, depth, market status, and timestamps before evaluating it.
Where the gap comes from
Each exchange has its own order flow, participants, market makers, limits, and reaction speed. Even equivalent perpetual contracts do not have to share the same last price.
- A thin book reacts more strongly to one large order.
- Local data lag can create a false visual gap.
- Delisting or restriction risk often widens basis.
Last, mark, and index price
Last price is the latest trade, mark price is commonly used for PnL and liquidation, and index price anchors the contract to an external basket. They answer different questions.
- Executable bid/ask and depth matter for fills.
- The exchange-specific mark-price rules matter for liquidation.
How to read convergence history
The chart reveals the frequency, duration, and amplitude of dislocations. It provides context but cannot prove that the next episode will repeat the past.
- Compare the current spike with the route’s normal range.
- Check whether contract, liquidity, or market status has changed.
PRACTICE
Two identical percentages
Compare two 2% spreads: one appears for ten seconds in a deep market, while the other persists for an hour on a market facing delisting risk. Which one looks more reliable, and why?
? Show answer
Answer: The percentage alone is insufficient. The first may be a brief executable imbalance, but bid/ask and depth must be checked immediately. The second is not more reliable merely because it lasts longer: delisting risk may explain the gap and increase liquidity, trading-halt, and exit risk. Identical 2% readings do not represent identical opportunities.
Lesson checklist
- I checked executable bid/ask rather than only last price.
- I understand a plausible cause of the gap.
- I reviewed history and current market status.
Common mistakes
- Treating past convergence as a promise.
- Ignoring persistent basis as a sign of a separate risk.
Progress is recorded automatically when this section appears on screen.